Mathieu Martin |

The Degree Of Operating Leverage

Which techniques do you typically rely on to analyze companies? Do you emphasize criteria that are fairly easy to interpret, such as revenue growth and profitability? Or are you more of the intuitive type, relying mostly on your judgment?
I recently took some time to identify the main aspects I pay attention to when I analyze a company.
The concept I’m about to explain here is fascinating because it combines the art and science of investing. Intuition and theory.
Enter the Degree of Operational Leverage (DOL).
You may have heard of this concept before since it’s mentioned quite frequently by management teams and analysts. But what is it all about?
Essentially, the DOL provides an understanding of how fluctuations in revenue will translate to the company’s operating profits based on its fixed cost structure.
Let’s start with a few short definitions that will help you better understand DOL:
Variable costs: These are the costs directly associated with the production of a good or the delivery of a service. For example, if I produce a pencil for $0.50 and resell it for $1, each pencil sold will increase my variable costs by $0.50.
Fixed costs: These are the costs that do not vary based on sales. For example, if I signed a lease for my pencil factory, I will have to pay the same rent regardless of the number of pencils sold. It can also be staff, such as a factory manager who I will also have to pay regardless of my sales.
Earnings before interest and taxes (EBIT): This is the operating profit. It’s calculated as revenue minus variable and fixed costs.
NB: Interest and taxes are excluded from operating profit since they depend on the company’s financing structure (debt versus equity) and the jurisdiction in which it operates.
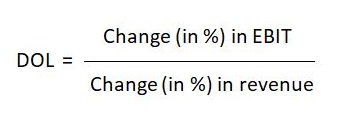
Now here’s how we calculate the Degree of Operating Leverage:
Here’s a simple example. In 2018, company ABC published the following financial results:
Revenue = $100,000
Variable costs (50% of sales) = $50,000
Fixed costs = $30,000
EBIT = $20,000
Then in 2019, ABC publishes de following results:
Revenue = $150,000
Variable costs (50% of sales) = $75,000
Fixed costs = $30,000
EBIT = $45,000
In this example, company ABC experienced a 50% revenue growth ($150,000 versus $100,000). Its EBIT, on the other hand, increased by 125% ($45,000 versus $20,000). What was the degree of operating leverage?
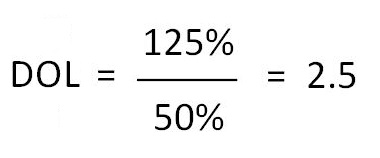
For every 1% increase in revenue, operating profit (EBIT) grew 2.5 times faster or 2.5%. Why? Because the fixed costs did not increase.
The more fixed costs a business has as a proportion of its total costs, the greater the degree of operating leverage. Revenue growth will thus be accompanied by an even greater increase in operating profits. A high DOL is, therefore, desirable for a growing company.
Since the value of a business is ultimately based on its future cash flows, a high DOL combined with strong revenue growth means higher future profits and a higher value for the company.
How To Use The DOL
Before you get worried about these calculations, I want to reassure you that I’m not explicitly calculating the DOL of every company I analyze. The fixed and variable expenses of companies change over time, so does the DOL.
On the other hand, it’s important to intuitively understand the concept to better anticipate the future results of the companies you are about to invest in. This is where art meets science.
Here are some basic questions I typically ask myself:
- What is the expected revenue growth for the coming year(s)?
- How have operating expenses (general and administrative expenses, sales and marketing, research and development) been changing in recent years? Did they increase at the same pace as revenue, or were they relatively stable over time? The more the expenses seem fixed, the higher the DOL should be.
- Has the company achieved profitability only recently? When a business has just become profitable, that means its revenue now covers all variable and fixed costs, plus an operating profit (EBIT). When this point has recently been reached, the profit margin (EBIT/Revenue) is likely low. At this point, the DOL will usually be the highest.
My Ideal Scenario
Thinking about those previous questions helps me when I make forecasts for the upcoming years, even though it remains highly uncertain, especially with microcaps. What I’m looking for is:
- Strong revenue growth (as high as possible).
- Lots of fixed costs, which means operating expenses will not increase materially as a result of strong revenue growth.
- An operating margin (EBIT margin) that is initially low. As a percentage, it should increase very quickly if the first two criteria are met.
If my assumptions prove to be correct, the returns on the stock can be quite impressive. There’s nothing better than rapidly increasing profits to increase the value of a company.
The Dark Side Of Operating Leverage
As nothing is perfect in life, operating leverage also comes with significant risk. The main one is that fixed costs are typically challenging to adjust or, more specifically, to reduce.
If a company is counting on strong revenue growth to cover its fixed costs and the growth doesn’t materialize, the company can find itself in trouble. As much as operating leverage can have a positive impact on the profits of a growing company, it can also work in reverse. A decrease in revenue will result in an even more significant drop in EBIT and could even lead to losses. Be careful because the situation can quickly get worse.
As you probably know, leverage (operating or otherwise) can be a formidable tool under the right circumstances. However, it should be used with caution and moderation.
The next time you research a company, try incorporating the DOL concept into your analysis and play around with the different hypotheses. It’s a great framework to develop your intuition about a company’s future results.
There are no magic numbers or precise rules for using DOL. It’s up to you to develop your intuition to use it wisely!